It’s January 2013 and across the nation there are some great scholastic basketball players performing in packed houses and with college coaches salivating all over their Nike, Adidas and Under Armour golf shirts. The athletic departments’ private jets were burning an ungodly amount of fuel that winter. Some of the best known prospects at the time were Andrew Wiggins (Huntington Prep, Huntington, West Virginia), Jabari Parker (Simeon HS, Chicago, Illinois), Julius Randle (Prestonwood Christian Academy, MicKinney, Texas), Aaron Gordon (Archbishop Mitty High School, San Jose, California) and some big kid named Joel Embid (The Rock School, Gainesville, Florida).
Duke, Kansas, Arizona, Kentucky and the other college basketball blue bloods were like sharks in the water. This was truly a great year for high school basketball and Philly was well represented. Steve Vasturia (St. Joseph’s Prep), Brandon Austin (Imhotep) and JaQuan Newton (Neumann-Goretti) were skilfully plying their trade.

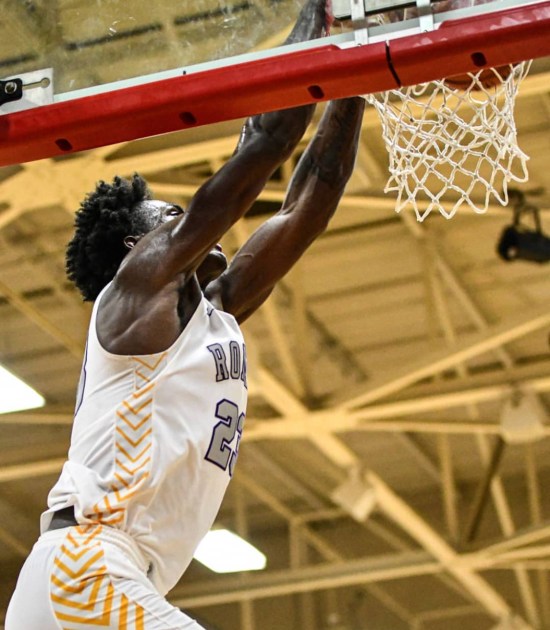
Rysheed Jordan, Camden Monarchs
But for the common folk, there can be no doubt, the Prince of ‘Norf’ Philly reigned supreme… UCLA, St. John’s and Temple basketball coaches were regular visitors to neighborhood of North Philadelphia known as Sharswood. They were stalking Rysheed Jordan… Members of college basketball’s royalty were frequently roaming on and about the grounds of the Norman Blumberg Apartments. Middle-aged wealthy white millionaires didn’t make their way though Sharswood too often. The poverty and crime rates at Blumberg were double the rest of the city’s. At the time, Blumberg was considered PHA’s “most distressed” public housing complex. So much so that three years later, they hit the detonation button and blew it up, reducing it to pile of rubble.
But in 2013, Sharswood was the place to be… Especially if you were a hoophead seeking out the very best action or a high major college basketball coach looking for a player with the potential to lead you to a Final Four or even a National Championship.
Rysheed Jordan and Robert Vaux High School were vying for Philadelphia basketball supremacy. Keep in mind, Vaux had never been a factor before the Phoenix-like rise of Jordan. Indeed, Vaux was literally on it’s last legs. In March, 2013, The School District of Philadelphia voted to close Vaux and 22 other district-run schools at the end of the school year.
Rasheed Jordan, unlike most of the other high profile prospects of his era, played with his childhood friends at an under-performing neighborhood public high school.
What? This just doesn’t happen… The lure of “national” schedules and ESPN games typically overrides any commitment to family and friends at the neighborhood school…
But, Jordan was different… Very different!
Ranked #17 in the nation by ESPN, Jordan could have easily fled to one of the national basketball academies like Huntington Prep, IMG, Montverde or Findlay Prep… He didn’t…
He could have chosen to suit up for one of the Catholic League powerhouse programs like Roman Catholic, Neumann-Goretti of Archbishop Caroll… He didn’t…
He resisted the lure of prominent Charter programs like Imhotep, Math, Civics and Sciences (MCS), and Boy’s Latin…
Sheed stayed ‘round da way… He rose to national prominence playing for his neighborhood high school… He played basketball with the same guys he ate free lunches with in 3rd grade… He played in front of passionate and frenzied crowds with the scent of ‘loud’ wafting through the air…
Undying loyalty to his friends, his teammates, his coaches and his ‘hood’ made Sheed’s journey special… The love and affection was returned 100-fold!
His friends, his teammates, his coaches and his ‘hood’ supported the Prince in a manner impossible to explain to people from outside of Philadelphia.
These muthafuckas rode unbelievably HARD for Sheed!
As a result, he didn’t need the basketball academies… He didn’t need the Catholic or Independent schools… He didn’t need the Charters… He didn’t need the EYBL…
Sharswood, Vaux and Philly Pride stood behind and beside Jordan as he embarked on one of the greatest scholastic careers Philadelphia has witnessed over the past 2 decades. The fact that he did it with the same dudes that he cut that hard ass government cheese with made it sooooooo special.
It’s worth detailing some of the important moments for the uninitiated…
Seven years ago, in January 2013, the boys from Norf Philly went Uptown and spanked Imhotep Charter and Brandon Austin in one the toughest gyms in the State of Pennsylvania. Led by Jordan, Vaux went on a 21-2 fourth-quarter run to hand Imhotep its worst ever home loss.
Vaux and Imhotep would finish the regular season tied for second behind a loaded MCS squad. In the first round of the the playoffs, Jordan dropped 21 to lead Vaux to an easy 24 point victory over GAMP. In the round of 16, he scored 21 points to support Sammy Foreman’s 24 as Vaux rolled over Sankofa by 22 points, 87-65.
Then… Shit got real interesting in the Quarterfinals… Vaux faced the #1 team in the City, regular season Division A Champions MCS. MCS entered the game with a gaudy 23-1 record. In front of a packed house, Jordan put on his cape and poured in 29 points to go along with seven rebounds, five assists and four steals. With 10.7 seconds remaining in the game, after a 5-minute delay to control the ‘hood’ that was spilling onto the court, Jordan calmly sank two free throws to tie the game 61-61. Then Jordan knocked down the second of two free throws with one-tenth of a second remaining after he was fouled attempting to finish a full court sprint with the ball that began with 4.7 on the clock.
Legendary shit… The Prince of Norf, playing against the top ranked team, for the hood school in an overfilled South Philly high school gym with everything on the line…
Next up, a rematch with mighty Imhotep and their star Brandon Austin at the Liacouras Center on the campus of Temple University. This time, Vaux fell short… Imhotep won (67-66) their fourth Public League Championship in five years and avenged the 22-point, home-court spanking Vaux laid on them in January. However, legendary status of Jordan was cemented in the loss. Jordan exploded for 45 points, breaking Wilt Chamberlain’s record (40) for the most ever scored in any version of a High School Championship game.
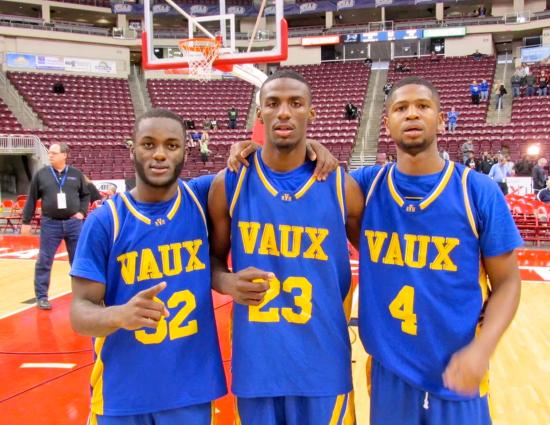
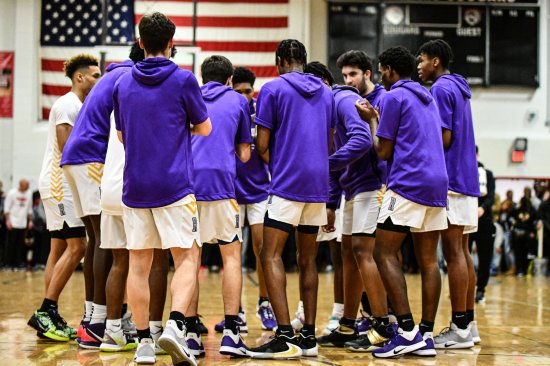
Rysheed Jordan (center), following state championship victory
A couple weeks later, Jordan score 32 points to lead Vaux to the PIAA Class A State Championship with a 20 point 83-63 victory over Johnsonburg HS at the Giant Center in Hershey, PA. Take a step back… Let’s think about this… Sheed Jordan led his troubled neighborhood high school to its first and only state title about 12 weeks before the City would shut it down.
Legendary shit…
Three weeks later, the Prince of Norf would commit to Steve Lavin and St. John’s University of the Big East Conference. Eschewing offers from UCLA and hometown Temple University, Sheed chose the bright lights of New York City and Madison Square Garden.

Rysheed Jordan, St. John’s University
As a freshman, Jordan lived up to expectations… He averaged 10 ppg, 3.1 rpg and 3.0 apg and was named to the All-Rookie team in the Big East. He upped his scoring to 14.1 ppg as a sophomore while grabbing 3.7 rpg and dishing 3.1 apg.
At the conclusion of his sophomore campaign, St. John’s fired Steve Lavin and hired Chris Mullin as head coach. Jordan would never play for Mullin…
The Prince of Norf had a nice 2-year run at Madison Square Garden… Then it ended abruptly…
In the first week of June 2015… the divorce was finalized.
“Playing professional basketball has always been a goal of mine,” Jordan said in a statement released by St. John’s. “I believe I am ready to take the next step in my basketball career and plan to work hard to achieve my dream of playing in the NBA . . . This decision was made with my family’s best interests in mind.”
Chris Mullin said “We support Rysheed and wish him well in his professional endeavors.”
The timing of the divorce, however, was very problematic… Jordan was ineligible for the 2015 NBA draft because he missed the early-entry deadline. His college career over, Jordan could not play in the NBA until 2016 at the earliest.
Fuck!
This would prove to be a very costly paperwork snafu… A really, really bad fumble… Things never really got on track from there.
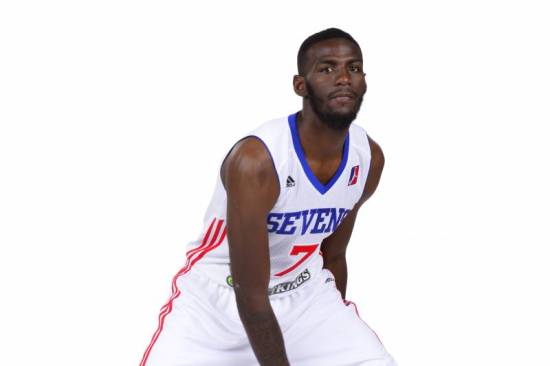
Rysheed Jordan, Delaware 87ers
Jordan would play in the D-League for the Delaware 87ers in 2015-16, averaging just over eight points per contest in 11 games. Eventually, he kinda just disappeared from the basketball scene altogether and retreated to his beloved ‘hood.’
Then… on June 1, 2016, almost exactly one year after separating from St. John’s University, Jordan was arrested and charged with multiple offenses stemming from two separate incidents over the preceding week.
Both incidents, per information provided by the Philadelphia Police Department, occurred in North Philadelphia. Jordan was charged with attempted murder, robbery, criminal conspiracy and simple assault.
Police alleged that Jordan shot a man in the arm.
According to police, the 23-year-old victim of the shooting and his companion, the witness, had gone to the area around 1400 North 26th street to purchase marijuana. They left their vehicle and approached a gold sedan, but the meet went sideways. Jordan’s group got out of the car with guns, and one of them ordered, “Give us your money and your phones.”
The victim and witness ran back to their vehicle, but Jordan’s group allegedly fired. The victim was hit in the right arm but managed to make it in the car. The witness began to back up, and the two were able to escape despite the fact that one of the offenders tried to reach inside the car window and turn off the ignition in addition to firing several shots.
The victim and witness found a policeman at 33rd and Girard and were brought to Hospital of the University of Pennsylvania, where the victim underwent surgery.
Jordan was captured by Temple police early Wednesday morning after an unrelated incident. At 2:03 a.m., police tracked a green Jaguar that had run a red light. After the vehicle allegedly tried to evade police, Jordan got out and fled. He was pursued by officers on foot and threw away his gun before being captured and placed into custody. Recovered by police, the gun had five live rounds and an obliterated serial number.
A little over a month later, on June 16 defense lawyer Brad V. Shuttleworth asked Municipal Court Judge Marvin L. Williams to lower bail to $100,000, so Jordan could post the usual 10 percent (i.e., $10,000) and walk free pending trial, wearing an electronic monitoring bracelet. Judge Williams refused, however, saying that Jordan has proved he will run from the law and that he’s a danger to the community.
Jordan would remain in custody until December 1, 2019. He a did a 3.5 year bid. He emerged remorseful and eager to make a difference in the lives of the young men finding their way through his ‘hood’.
As soon as he was released, Jordan made his way to local gyms… Not to play…
https://www.instagram.com/p/B6Ost4yh3Z2/?utm_source=ig_web_copy_link
He had to share what he learned the hard way… He had to talk to young Black men about his poor choices…
It’s his calling. Jordan is at peace with himself, he has paid a heavy toll for his actions. A spiritual man, he seeks to uplift those willing to listen and learn.
Fully cognizant of the heavy sway he still holds over the City of Philadelphia, especially young men on the Norf side, Jordan tells cautionary tales these days. He is man that has done everything society has asked of him.
Young enough to fully relate to what young impressionable inner-city Black males experience on a daily basis, he is able to capture their undivided attention.
His fame and status hasn’t waned… He’s still the Prince of Norf… Older, wiser and thankful for an opportunity to make a difference.
Jordan is repentant… He lost his beloved mother while he was away… He is determined to fulfill his responsibilities as the head of his family…
While working out with his younger brother and the team at MCS, the urge to play competitively began to slowly creep back in…
Jordan had a basketball itch he needed to scratch.
Enter the Reverend, Stan Laws and the Camden Monarchs.
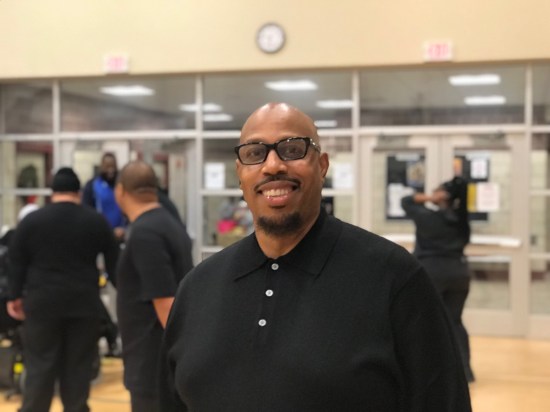
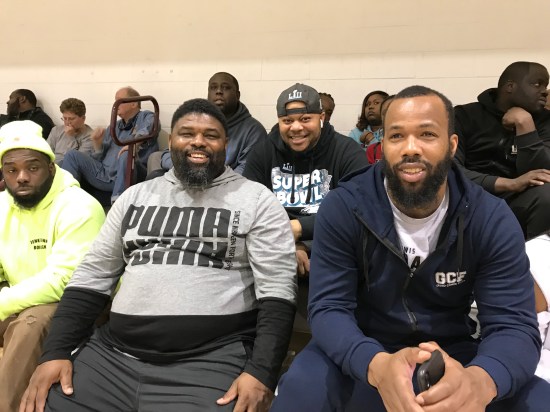
Reverend Stan Laws, Camden Monarchs Head Coach
Laws is a stalwart in the Philadelphia Basketball community and long-time Norfside resident. He’s also the Head Coach of the Camden Monarchs. Laws and his boss, General Manager Joseph Richmond have given Jordan an opportunity to compete at the professional level without uprooting him from his family and the supports he has in place.

Joseph Richmond (left), Camden Monarchs General Manager
The Monarchs fittingly play their home games in the Salvation Army’s Kroc Center. This is the prefect location for the resurrection of Jordan’s playing career. Laws and Richmond are spiritual men committed to using basketball as a tool for deliverance from sin and its consequences.
Every day, they try to live their life in accordance with the word of God. Ephesians 4:31-32 – Get rid of all bitterness, rage and anger, brawling and slander, along with every form of malice. Be kind to one another, tenderhearted, forgiving one another as God in Christ forgave you.
So on January 11, three and half years removed from the date he went away, Rasheed Jordan played basketball in front of a crowd with the lights on. Now… it wasn’t the 19,738 capacity crowd he entertained at Madison Square Garden. But the 400+ people that shoehorned themselves into the Kroc Center came with one goal in mind, to lift up the Prince of Norf.
The level of competition on this night was probably somewhere between NCAA Division 2 and Division 3. Laws did not start Jordan… Upon entering the game, one could sense that Jordan just wanted to be a teammate… He wanted to play the right way… He was playing very conservatively and unselfishly…
His timing was off… He would beat his man and the floater would fall short… Way short… He would blow by the initial defender, see the help defender coming but his reflexes just aren’t there yet… They were able to get their hands on the ball and prevent him from finishing…
“Just play Sheed… Just play…”
His supporters could feel him working his way into the game… He was supportive of his teammates and trying to find ways to make winning plays…
Forced to gauge him against at his very best… Jordan was about 50%… He was visibly winded at times and he was a half second slow…
He’e been away 3 and half years…
That said, Jordan at 50% finished the game with 28 points, 8 rebounds and 7 assists. His team went into the locker room down at the half… Laws started Jordan in the second half… Camden ended up winning 116-82.
It’s all still there… The bounce… The sweet pull-up… The handle… The will to win…
Like a musician that had to put his saxophone away for 40 months, it’s gonna take a little time to get it all back… But he can still play music you want to hear.

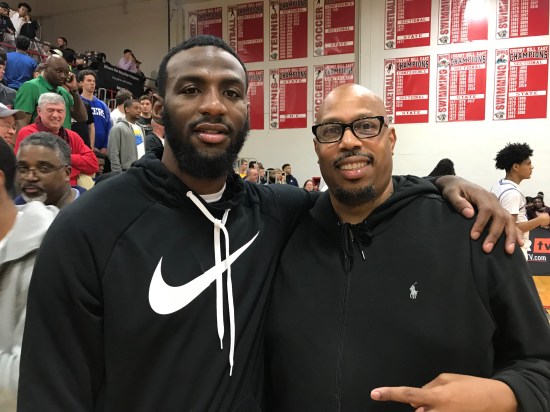
Lewis Leonard and family
Supportive Philly hoop heads came out to see the first show… Lewis Leonard, Mookie Laws, Randy Miller, Mike Terry, Rodney Veney, Maurice Watson, Sr. and Dallas Comegys were just a few Philadelphia hoopheads that made their way across the bridge.

Rysheed Jordan, after his first game with the Camden Monarchs
There will be many more… The Prince of Norf is playing in East Camden… I’ll see you at the next Camden Monarchs home game.