A Comparison of A10 Academic Progress Rates, 2004-12


The coaches have been contacting you for months.  The tweet, texts, direct messages, facebook hits seem endless.  One thing is clear, they want you to come play basketball for them.  They have explained how you fit into their plans and their system.  Now, they are coming to visit you at home and you are taking official visits to their campus.

The coaches have been contacting you for months.  The tweet, texts, direct messages, facebook hits seem endless.  One thing is clear, they want you to come play basketball for them.  They have explained how you fit into their plans and their system.  Now, they are coming to visit you at home and you are taking official visits to their campus.  

They are going to show you the campus, the arena, the locker room, the media room, the weight room, the practice gym, the dormitory, the cafeteria and the pretty girls.  It all feels right.  You are ready to commit.  At this point, you should ask one VERY important question:  Coach, do you graduate your players?

When he gives you a response don’t just take his word for it.  Together with your parents and advisors check the record.  The Academic Progress Rate is a Division I metric developed to track the academic achievement of teams each academic term.  Each student-athlete receiving athletically related financial aid earns one retention point for staying in school and one eligibility point for being academically eligible. A team’s total points are divided by points possible and then multiplied by one thousand to equal the team’s Academic Progress Rate score.

The above chart lists the A10 programs in order, highest average APR to lowest average APR over an 8 year period spanning 2004-2012.  Using this chart, parents and potential recruits can compare the level of academic achievement across A10 programs.  Also, the average APR data for all Division 1 Men’s Basketball Programs is included for comparative purposes.

Within the A10 Conference, only 4 programs, Fordham, Duquesne, Massachusetts and St. Bonaventure have APR averages below the APR average for all Division 1 basketball programs.

This information is very useful to parents and students weighing scholarship offers from multiple universities.  It provides a way of quickly gauging a program’s ability, over time, to retain players and keep them on track to graduate.  The Black Cager will provide this information for all Division 1 Conferences over the next few weeks.

A10 Average APR Rankings  

2004-05 2005-06 2006-07 2007-08 2008-09 2009-10 2010-11 2011-12  2004-08 Avg.
Dayton 980 979 974 979 979 985 990 985 981.375
George Mason 918 945 969 995 995 990 975 980 970.875
Saint Louis 1000 986 979 947 935 925 923 950 955.6
VCU 920 947 949 985 975 949 956 960 955.1
Richmond  910 931 925 936 967 974 995 1000 954.8
LaSalle 917 928 935 956 973 970 969 974 952.8
George Washington 941 948 946 917 936 950 966 975 947.4
Rhode Island 961 946 938 941 950 957 952 926 946.4
Saint Joseph’s 929 920 921 944 939 949 949 953 938.0
All D1 BBall Programs 927 927 928 933 940 945 950 952 937.8
Fordham 930 924 929 947 943 933 933 933 934.0
Duquesne 961 909 914 906 912 960 956 953 933.9
Massachusetts 894 920 903 931 930 928 949 944 924.9
St. Bonaventure 906 921 897 904 906 894 929 972 916.1

“Choosing” Catholic School in Philadelphia: The Case of Tracey Stanton-Wilson

Image


A graduate of Philadelphia High School for Girl’s, Tracey Stanton-Wilson has maintained a life-long commitment to public education.  Her husband, Darrell Wilson graduated from Lamberton High School in Philadelphia’s Overbrook section.  Her oldest son Kyle, attended Universal Charter for middle school and graduated from Preparatory Charter HS before heading off to college.  Last fall, as she was assessing the options for her then 8th grade son Darrell, Jr. she focused exclusively on public and charter schools.  That is, until she received a phone call.

In February, a family friend called and invited Tracey to attend a “focus group” being conducted at West Catholic HS.  At first, Tracey was hesitant because she assumed that the cost of Catholic HS would be prohibitive.  With her oldest in college and her daughter in a full-day private preschool, educational expenses were already presenting a challenge.  There was no way, she felt, that she could afford the tuition to Catholic HS.  Nonetheless, her friend encouraged her to attend the focus group and let them know that financial considerations were the primary barrier for her family.  After all, the aim of the focus group was to identify issues and concerns Philadelphia’s parents have about Catholic High Schools.  The Faith in the Future Foundation was trying to gain a better understanding of issues faced by parents of school-age children.

During the focus group, Tracey and 14 other parents were provided with information regarding West Catholic High School academic programs and Catholic education in Philadelphia.  They were also asked a series of open-ended questions about their school selection processes.  What were the factors influencing their selection?  Was Catholic education a viable option?  If not, why not?  Tracey was very impressed with responsiveness of moderator, Patti Boyle from the Faith in the Future Foundation as well as the West Catholic HS Director of Admissions, John Jenkins.  So much so that, along with several other parents, Tracey completed an application for admission and financial aid.

However, she remained concerned about the cost.  Could the Faith in the Future Foundation provide enough aid to make attending West Catholic feasible?  Over the next few months, she maintained constant contact with Mr. Jenkins.  When the initial financial aid offer was not sufficient to meet her family’s needs, Tracey was disappointed and she let him know.  Mr. Jenkins was committed to identifying additional sources of financial aid for Tracey.  Through their ongoing dialogue, he came to realize that she was exactly the kind of parent, and that they were the type of family, he wanted to attract to West Catholic.  She was committed and passionate about education.  She was willing to sacrifice financially to ensure her child access to a high quality safe learning environment.

Tracey had a history of “choosing” strong educational placements.  As a student, she “chose” to attend highly competitive Girl’s High.  As a parent, she enrolled her oldest son in Prep Charter, one of the better performing Philadelphia Charter High Schools.  With Darrell, Jr. she was ready to choose Catholic education.  While she remained committed to public education, Tracey was very concerned about some of recent developments within the School District of Philadelphia.

Facing a $300 million structural deficit and still uncertain whether it will get the increased revenue and labor concessions it was seeking, the School District was asking schools to prepare to operate next year with a principal and a bare-bones allotment of teachers – and just about nothing else.  The District sent ended up sending 3,783 layoff notices to assistant principals, teachers, counselors, noontime aides and others. Tracey considered the consequences.  That meant the contractual maximum class size in every classroom, 33 or more students in every classroom.  It meant no dedicated money for guidance counselors, interscholastic sports, extracurricular activities, librarians, art or music.  No money, even, for secretaries.  

After much discussion Tracey and Darrell, Sr. decided they had to make a decision that was in Darrell, Jr. best interest.  As concerned residents of the Grays Ferry community, they remain supporters of efforts of Universal Companies at Vare Middle School and Audenreid High School.  However, if they could negotiate a workable financial arrangement, they would send Darrell, Jr. to West Catholic Preparatory High School.

Tracey and Mr. Jenkins continued to work together and finally they were able to reach a point where monthly tuition payments were manageable.  The Faith in the Future Foundation has pledged to make high-quality Catholic education accessible to all Philadelphia families that want to attend Archdiocese schools.  According to Tracey Wilson, “Mr. Jenkins really worked with me to make this happen for my son.  I couldn’t be happier.” 


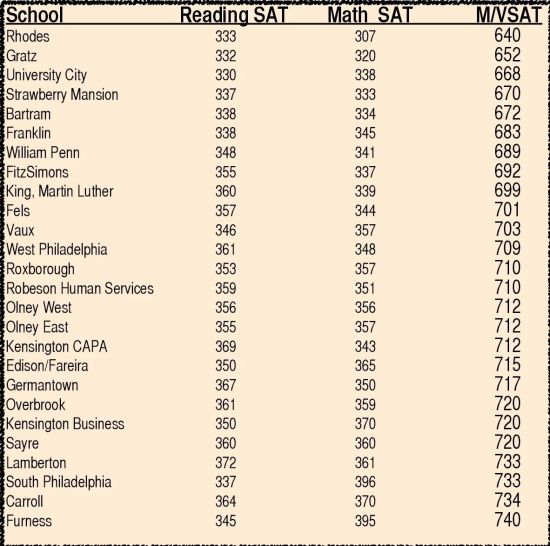
Average SAT Scores in Philly Charter Schools

Average SAT Scores in Philly Charter Schools

As you can see, Philadelphia’s charter schools are struggling to produce adequate SAT scores. The average scores for incoming freshmen at some local colleges are listed for comparison. Some charter school averages are 300-500 points below the average freshman score at local colleges. Only 5 charter schools have average scores that meet or exceed the NCAA minimum of 820 for D2 athletic scholarships. Some charter schools with nationally recognized athletic programs have scores well-below the NCAA minimum score.

Introducing TheBlackCager

TheBlackCager is a site dedicated to in-depth discussion of topics related to scholastic and collegiate athletics.  We will cover eligibility issues, recruiting, coaching, selecting an agent and life after the playing days are over.  All issues will be examined from a perspective that places African-American student-athletes at the center of the discussion.